While the detection, enumeration and size classification of foreign particulate material (FPM) is essential in many industries, one of its most critical applications is in the manufacture of pharmaceuticals. A variety of regulations and standards, notably USP 788 and USP 789 (explained below), impose tight controls on the levels of FPM permitted in certain pharmaceutical products.
In the past, light obscuration particle counting and manual microscopy have been the most commonly used techniques for the enumeration and characterisation of FPM. Light obscuration particle counting is, as its name suggests, purely a counting technique, which offers no possibility of recovering the counted particles for further microscopic or spectroscopic analysis. Manual microscopy on the other hand does give information about particle morphology and also allows particle recovery for further analyses. However, this labour-intensive and highly operator-dependent technique is now being superseded by rapid, fully automated imaging methods that are transforming the analysis of particulates on filters.
Defining FPM
FPM refers to extraneous contaminant particles, which in pharmaceutical manufacturing can include materials as diverse as glass, transparent synthetic fibres, stainless steel, rubber, aluminium and plastics. These may derive from active or excipient materials, or from the administration device - an inhaler or parenteral for example - where shearing or abrasion may occur during activation.
Serious safety concerns have driven the imposition of strict limits on FPM contamination. Standards published by the United States Pharmacopeia (USP) include USP 788 which specifies acceptable levels in injectable drugs, and USP 789 which defines limits for ophthalmics. In addition the US Food and Drug Administration requests that FPM in a wide range of pharmaceutical inhalation devices should be the subject of quality control limits in defined size ranges (<10 μm, 10-100 μm, and >100 μm). The International Pharmaceutical Aerosol Consortium on Regulations and Science (IPAC-RS) has also discussed testing for FPM in orally inhaled and nasal drug products.
Measuring FPM
Conventional FPM characterisation relies either on counting the particles in a suspension using light obscuration particle counters, or manual light microscopy examination of the FPM collected on a filter. Light obscuration particle counters are fast and relatively easy to use. However, since they are calibrated with spherical latex particles, sizing errors can be introduced when dealing with particles that are not spheres. In addition, any air bubbles in the suspension can give rise to false positives and it is not possible to recover the particles for further analysis.
Manual light microscopy gives information not only about a particle's size but also its shape, and can distinguish between highly reflective particles, such as metals, and dark particles such as rubber. It is also possible to conduct further analyses on the same sample using techniques such as Raman spectroscopy. Unfortunately manual light microscopy is prone to human error and operator subjectivity, especially given the considerable length of time required to manually count a sufficient number of particles. Consequently this technique is severely limited as a routine tool. Furthermore, when using manual methods it can be misleading to compare data obtained on different occasions since the results may differ according to the operator as well as between one situation and the next.
Recently introduced automated systems have enabled the combination of light microscopy and image analysis. The result is new levels of speed and objectivity, and the delivery of large amounts of data on the size and morphology of individual particles. Such a wealth of additional information allows more detailed investigation and effective troubleshooting, bringing improvements to both process and quality control.
Automation solution
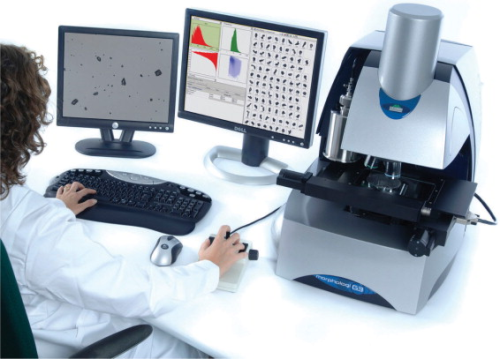
Automated imaging systems based on light microscopy require specific hardware and sophisticated software in order to perform the specialist task of measuring FPM on filters. Some of the essential features are described below taking as an example the Morphologi G3 automated particle characterisation system and presenting data that illustrate its application to measuring FPM in an inhaled pharmaceutical product.
Sample holder
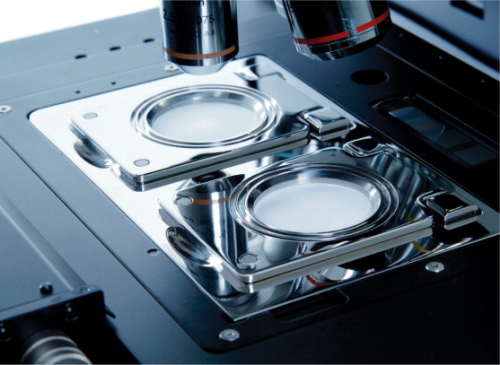
A prerequisite for automated analysis is that the filters on which the FPM are collected are held flat for consistent reliable measurement. In the system described here, this is achieved via a glassless sample carrier plate that stretches prepared filters with a magnetic clamping mechanism (see Figure 2). Two filters can be mounted at once for successive analysis without manual intervention. While it is important to have the option of glass slide carriers for those sample preparation methods developed using such systems, glassless carriers offer many advantages. Not only do they eliminate the risk of particles on the glass surface being counted, they prevent crushing of particles and simplify cleaning.
High resolution
High quality microscope objectives together with scientific grade cameras enable the analysis of particles as small as 2 μm. Even at such small sizes, images contain enough pixels to allow the clear discrimination of foreign particles.
Particle stitching
FPM takes many shapes and forms. Fibrous particles can pose a particular challenge in that they typically occupy two or more frames. It is important that an image analyser can identify when this occurs. The software must identify such frames, ‘stitch’ them together and then extract the whole edge-stitched particle from the background.
z-stacking
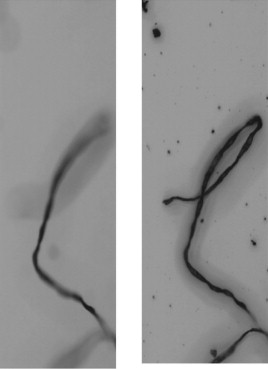
z-stacking allows images taken at different focal points to be combined before the particles are separated from the background. As a result, both large and small particles remain in focus and included in the measurement. Figure 3 shows a section of a frame containing a fibrous particle, with and without z-stacking.
Dual threshold
The implementation of a dual threshold allows the detection of both bright and dark particles. Without this feature, single particles with both bright and dark areas — as is typical for metals, for example - may be fragmented into different parts rather than single entities.
Composite image generation
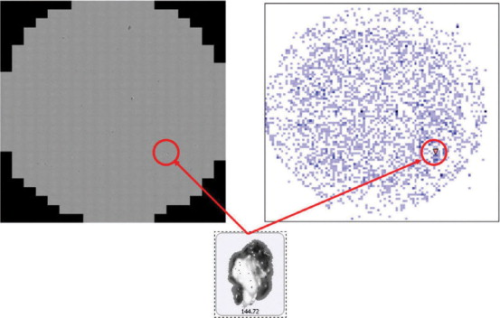
At the end of each analysis a composite image of the whole scanned area is generated automatically. This verifies both that the filter was in focus and there were no faults in the paper. The combination of composite image and X-Y scatter plot allows visualisation of the position of particles on a filter, and assessment of the filtration quality (see Figure 4). The composite image also provides a permanent electronic record that demonstrates to the regulatory authorities exactly what was measured.
Enumerating FPM in inhaled products
A standard operating procedure (SOP) was set up in the Morphologi software to analyse filter papers and to detect and count particles in specific size classes, according to the regulations governing the development and quality control of inhaled products (≥2 < 10 μm; ≥10 < 100 μm; and >100 μm). The area for analysis was 10 mm in diameter. A circular scan of the whole area with z-stacking took approximately 20 minutes. At the beginning and end of every measurement a verification of the light intensity is performed and recorded to ensure reproducible results. In addition, a pixel calibration is always carried out on the NPL (NIST) certified gratings that are integrated in the XY stage.
Results
Instrument repeatability is demonstrated in Table 1 where six repeat measurements were carried out on the same filter sample. The same sample was also measured three times each day for three consecutive days. The results are shown in Table 2. In each case high reproducibility and repeatability are demonstrated.
Table 1. Results of repeatability test where six repeat measurements were performed on the same filter (Analyses were not carried out in a controlled clean environment). Number of particles
Run number Total Length ≥ 2 < 10 μm Length ≥ 10 < 100 μm Length ≥ 100μm 1 13893 13025 858 10 2 13853 12976 867 10 3 13945 13066 872 7 4 14211 13334 868 9 5 13952 13108 835 9 6 13855 12982 863 10 Mean 13592 13082 860 9 RSD (%) 0.96 1.01 1.55 12.75
Table 2.Results of repeatability test where a sample was measured three times each day for three consecutive days (Analyses were not carried out in a controlled clean environment). Number of particles
Run number Total Length ≥ 2 < 10 μm Length ≥ 10 < 100 μm Length ≥ 100 μm Day 1 Scan 1 13893 13025 858 10 Day 1 Scan 2 13853 12976 867 10 Day 1 Scan 3 13945 13066 872 7 Day 2 Scan 1 13820 12935 875 10 Day 2 Scan 2 14262 13358 894 10 Day 2 Scan 3 13896 12984 901 11 Day 3 Scan 1 14216 13315 886 15 Day 3 Scan 2 14856 13911 932 13 Day 3 Scan 3 14781 13839 927 15 Mean 14169 13268 890 11 RSD (%) 2.82 2.82 2.92 23.48
Conclusion
Enumerating FPM on filters is essential for pharmaceutical products. While traditionally light obscuration counting techniques and manual microscopy have been used for this purpose, automation allows much improved statistical sampling. SOP-driven analysis eliminates operator fatigue and subjectivity, providing complete transferability from the research laboratory to quality control - exactly the same measurement criteria can be applied each time.
Results obtained using the Morphologi G3 demonstrate that automated image analysis is a powerful solution for FPM measurement on filters, enabling the rapid analysis of large numbers of particles and their automatic classification into size brackets. In addition, from the very high quality images obtained, a wealth of particle size and shape characteristics are automatically recorded, enabling a much greater understanding of products and processes.


