Introduction
Air cleaning or disinfecting devices (ACDDs) are widely used in central air-conditioning systems (CACS) to separate dust, airborne microorganisms or prevent gas contamination. In general, these devices are classified according to many different national and international standards. However, China lacks a national standard for testing and classifying these ACDDs used in CACS. Due to the extensive occurrence of Severe Acute Respiratory Syndrome (SARS), since 2003 a set of health management methods for public central air-conditioning systems have been established by the Ministry of Health of The People's Republic of China to strengthen public sanitation administration. It was demonstrated that ACDDs, employed in CACS, had an important influence on contamination control. The test system for these ACDDs was ambiguously mentioned as an aerodynamics test rig in these methods, but its principle and operation instructions were not presented, making it difficult for ACDD manufacturers to construct their own experimental setups to test products.
Data on airborne microorganisms are increasingly frequently reported in the scientific literature because of the known adverse health effects of such particles. ACDDs employed in CACS have become an important issue because of related health effects. The aim of the study was to design and construct a multifunctional experimental setup that can determine various ACDDs, such as general ventilation air filters, high efficiency particulate air (HEPA) filters and air line cleaners, removal efficiencies for different test aerosols, e.g. atmospheric dust, airborne aerosol and formaldehyde, etc. For the quick determination of the removal efficiency of ACDDs, the new multifunctional experimental setup operates with two instruments, such as optical particle counters, Andersen viable particle samplers and gas samplers, which simultaneously perform on-line measurements of the test aerosol concentration in the raw and clean gas flow of a test ACDD. With this test rig, performance of ACDDs, such as the removal efficiency, dust holding capacity and the pressure drop, can be easily determined following an exact testing procedure. The measurements are either done with synthetic dust of definite composition or atmospheric dust of the ambient air. The efficiency is determined gravimetrically, photometrically or indirectly by following spectral analysis or germiculture. Previous investigations for air filters were conducted with an apparatus of similar design. The obtained experimental results and valuable experience led to the construction of this new setup. Current national standards for HEPA and ULPA filters are also beneficial to design and construct the multifunctional setup (EN1822 (1998); IEST-RP-CC-001.4(2005); ASHRAE 52.2 (1992)).
Experimental setup
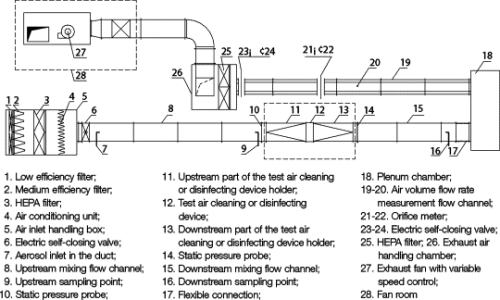
The experimental setup, as shown in Figure 1, is made up of three main parts: the aerosol generation unit, the flow channel and the actual measuring unit.
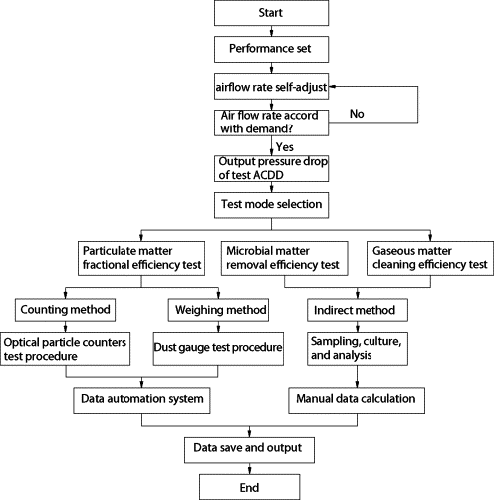
Multifunctional – this set-up can satisfy different size ACDDs with various nominal flow rates. Multi-performance indexes, such as pressure drop, counting efficiency (or weighing efficiency) for atmospheric dust (or artificial dust), gas (formaldehyde, ammonia, toluene, etc) removal efficiency, and microorganism (bacteria, fungal spores and pollen) cleaning efficiency for artificial microbes (or atmospheric microbes), can be obtained. It can be employed as not only a general ventilation filter performance test rig but also as a HEPA and ULPA performance test platform. The flow diagram of performance test system of this new experimental setup is shown in Figure 2.
Intelligent – the ACDD performance test software used is based on Visual Basic programming language. The interactive GUI program includes a real-time data display, operating mode display and a trend curve display. This control system can auto-regulate air flow rate according to customer requirements. By changing the air flow, the face velocity of the test can be altered and adjusted to different nominal face velocities ranging from 0.5 to 8.0 m/s which are typical for ACDD used in CACS. This test rig can also be used as a general ventilation air filter performance test system.
Flow channel
The flow channel was composed of an air inlet handling box, upstream mixing duct, downstream mixing duct, plenum chamber, air volume flow rate measurement channel, exhaust air handling chamber and exhaust fan.
The air inlet handling box consisted of a low efficiency filter, medium efficiency filter, HEPA filter and air conditioning unit. The three class filters are used to reduce basic contamination level and provide clean air, especially when test high efficiency ACDDs, such as HEPA or ULPA filters.
The upstream mixing flow channel, a tubular flow channel, should be long enough, generally ten times flow flow channel equivalent diameter, to insure that the aerosol produced by the suspension nebuliser is adequately mixed with the flow channel air and no droplets remain in the aerosol. The aerosol flows in a perpendicular direction towards the ACDD holder. The holder for the sample can be removed without changing the position of the two concentration measuring instruments. This allows a large number of tests in a short time.
The main characteristics of this flow channel are given as follows:
• Negative pressure – the total air flow channel operates under negative pressure which is produced by the installed exhaust fan. Otherwise, some harmful test aerosols may be able to leak through the air duct and protection will be compromised.
• Modular structure – as with the experimental setup, it is able to perform experiments not only with dust particles but also with airborne biological particles (bacteria, fungal spores and pollen) and gas contamination (formaldehyde, ammonia, etc.). For this purpose the apparatus has to be easy to dismantle for cleaning or disinfecting all crucial parts of the apparatus. Therefore, the flow channel is designed as several modular parts. For example, the air inlet handling box can be disassembled easily and moved away from the upstream mixing duct because of four versatile wheels installed at the bottom of the box brackets. This is beneficial to test aerosol conversion operations between atmospheric dust and other manual aerosols. In addition, the plenum chamber and exhaust air handling box are also fitted with wheels.
Actual measuring and control unit
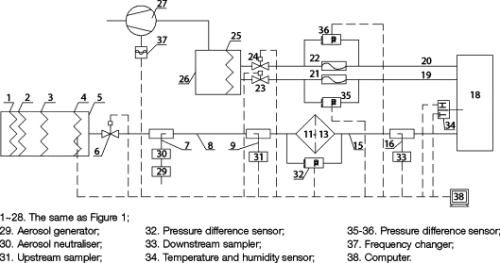
The schematic diagram of the data acquisition and control system of the experimental setup is shown in Figure 3. Across the ACDD holder the pressure drop P of the test ACDD is measured by a pressure difference sensor. The aerosol concentration upstream and downstream of the test ACDD is measured using two identical instruments. One is located before and the other behind the test ACDD. Test aerosol concentration is measured upstream and downstream from the ACDD using two measuring instruments in parallel. If the level of the upstream concentration exceeds the measuring range of the instrument then a dilution system shall be included between the sampling point and the instrument. Various apparatuses can be employed to measure upstream and downstream aerosol concentration
The test air temperature and relative humidity can be monitored by temperature and humidity sensor installed in the middle of the plenum chamber. The relative humidity of the air can be varied between 20% and 80% by controlling the air conditioning unit. Behind the plenum chamber the air flow is monitored by two different orifice meters for different volume range.
Previous investigations have shown that test aerosol sampling volumes are very small compared with the cross section of the flow channel, the sampling can be regarded as representative because the aerosol should be uniformly dispersed across the flow channel. Inhomogeneities in the aerosol flow caused by the test ACDD vanish rapidly, thus their influence on the measurements can be disregarded because the measuring volumes have a sufficient distance to the test ACDD.
The operating instructions provided by the test equipment manufacturer should be followed. All test instruments should be calibrated per manufacturers' instructions. The accuracy of all measurements is ±10% of reading unless otherwise specified. It is important that the proper flow rate through the ACDD be established prior to the test, the uniformity of airflow approaching the ACDD must be established as part of qualifying the test system.
Results and discussion
To perform an accurate ACDD performance test, it is necessary that the challenge aerosol concentration be uniform over the entire upstream and downstream cross-section of the sampling port. In addition, verification of consistency of concentration is indispensable for the precise determination of the fractional efficiencies and was done by simultaneous measurements with the two instruments when no test ACDD was placed in the ACDD holder.
Uniformity of concentration
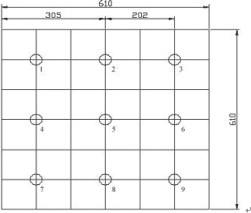
According to EN 1822[5], the sampling should be representative, which is the case when the aerosol concentration measured from the sample does not deviate by more than 10% from the mean value determined in accordance with the following demand. The aerosol input and the mixing duct shall be so constructed that the aerosol concentration measured at individual points of the duct cross section directly in front of the test ACDD shall not deviate by more than 10% from the mean value obtained from at least 9 measuring points spread evenly over the duct cross section. The location of the nine uniformly spaced sampling locations is determined by dividing the face area that the air flows through into squares or rectangles with the minimum possible aspect ratio (i.e., as close to square as possible). The sampling locations are the centre of each square or rectangle. For this experimental setup, locations of nine measuring points are shown in Figure 4; the fifth measuring point is the representative sampling point (RSP).
Consistency of concentration
According to EN 1822, the mean aerosol concentrations determined at the upstream and downstream sampling points without the test ACDD in position shall not differ from each other by more than 5%. Otherwise, larger measuring errors would occur due to unreasonable flow channel size, poor air duct tightness or incorrect location of sampling point. A case study of this verification for the test rig is given in Table 1. It can be seen that the experimental setup meets the above requirement. It indicates that the design of air flow channel is reasonable. From Table 1, it can be also seen that upstream concentration is a little larger than simultaneous downstream concentration. This phenomenon may be explained by particle diffusion, sedimentation, collision and conglutination.
| Particle size μm | 0.1 | 0.2 | 0.3 | 0.5 |
| Upstream particle number concentration (p/cft) | 5355 | 4887 | 3942 | 969 |
| Downstream particle number concentration (p/cft) | 5241 | 4740 | 3753 | 958 |
| Relative error | 2.1% | 3.0% | 4.8% | 1.1% |
Conclusions
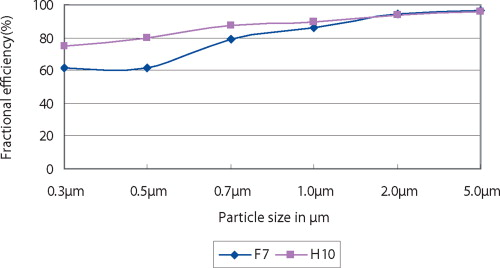
The aerodynamic experimental setup is designed and constructed to determine the performance of air cleaning or disinfecting devices used in central air-conditioning system. As a multifunctional test rig, it can be widely employed to measure various performances. These experimental results will be of great interest for air cleaning processes in many fields, such as clean room technologies and infection control technologies. In addition, the simultaneous in situ measurement of test aerosol concentration upstream and downstream of the test ACDD with two identical instruments allows a statistically reliable fractional efficiency determination in a short time. The first experiments with the new experimental setup for determining the fractional efficiencies of fibrous filters proved the apparatus is a valuable tool for characterising air filters.
Future work includes the removal efficiency measurements for bioaerosols (airborne bacteria, fungal spores and pollen) and gas contamination. Biological particles and gas contamination show different aerodynamic behaviour and adherence properties than dust particles and this will conse-quently result in different ACDD collection efficiencies. In general, removal efficiency of bioaerosol and gas contamination can not be obtained directly compared with dust particles, which may lead to some loss error, is this error significant? Moreover, natural decay of these two aerosol is usually faster than dust particles, especial fine particles. Exploring how to eliminate this effect on the removal efficiency is another issue.
Please contact the authors for references.This work was supported by the grants of China National Key Technology R&D Programs (2006BAJ02A10).A longer version of this article is available on www.filtsep.com.
Contact: Guoqing Cao and Yizhao Zhang, Institute of Building Environment and Energy Efficiency, China Academy of Building Research


